

You're probably in the same spot as most stablecoin holders who spend any time in DeFi. A dashboard shows an attractive yield. X is full of threads calling the protocol “safe.” The docs look polished. The TVL chart looks healthy at first glance. But the real question isn't whether the opportunity looks active. It's whether the yield is durable, or whether you're staring at a carefully dressed-up risk transfer.
That's where on-chain data stops being a buzzword and becomes a working tool.
Used well, on-chain data is the closest thing DeFi has to reading the plumbing instead of the marketing. You can inspect where funds moved, which contracts users touch, whether activity is broad or concentrated, and whether stablecoin inflows are supporting real usage or just bouncing around to manufacture confidence. That matters more now because on-chain analytics has grown far beyond hobbyist wallet watching. CoinDesk Data says its platform covers more than 7,000 assets and 10 blockchains on a block-by-block basis, which shows how far the category has matured into a serious analytics layer for crypto markets (CoinDesk Data on on-chain coverage).
For stablecoin yield, that shift changes the job. You're not trying to predict every market move. You're trying to answer a simpler and more profitable question: what kind of activity supports this yield, and what kind only imitates it?
The Search for Sustainable DeFi Yield
Stablecoin investors usually don't fail because they can't find opportunities. They fail because there are too many.
A lending market offers one rate. A vault offers another. A looping strategy screens even higher. Then a new protocol appears with a cleaner interface and stronger incentives. If you're busy, all of it starts to look the same. Capital goes to the option with the nicest mix of headline APY, social proof, and surface-level TVL.
That approach works right up until it doesn't.
What actually makes yield sustainable
For stablecoins, sustainable yield usually comes from something concrete. Borrow demand. Trading activity. Collateral demand. Treasury management. A real reason someone on the other side is paying for your capital.
Weak yield tends to rely on appearance. Incentives that mask poor usage. Deposits from a few large wallets. Circular movement between related contracts. Activity that can be seen, but not trusted at face value.
Practical rule: If you can't explain who is paying for the yield and why they'd keep paying, the on-chain data needs to do more work before you deposit.
On-chain analysis helps because it lets you inspect protocol behavior directly rather than rely on summaries from teams, influencers, or aggregators. But the edge isn't in knowing what active addresses or transaction volume mean in theory. The edge is in reading them together.
The shift from dashboard browsing to evidence
The initial focus is often on yield comparisons. Practitioners start with system health.
That means asking questions like:
Who uses this protocol: Is participation broad, or do a few wallets dominate activity?
How does capital move: Are stablecoins entering for clear utility, or churning between contracts?
What does usage look like over time: Is activity steady, or does it spike whenever incentives change?
Where could exits get crowded: If users rush out, is there enough liquidity depth to unwind cleanly?
For stablecoin yield, that's the primary use of on-chain data. It's less about spotting the highest number and more about avoiding the wrong kind of number.
What Is On-Chain Data Really
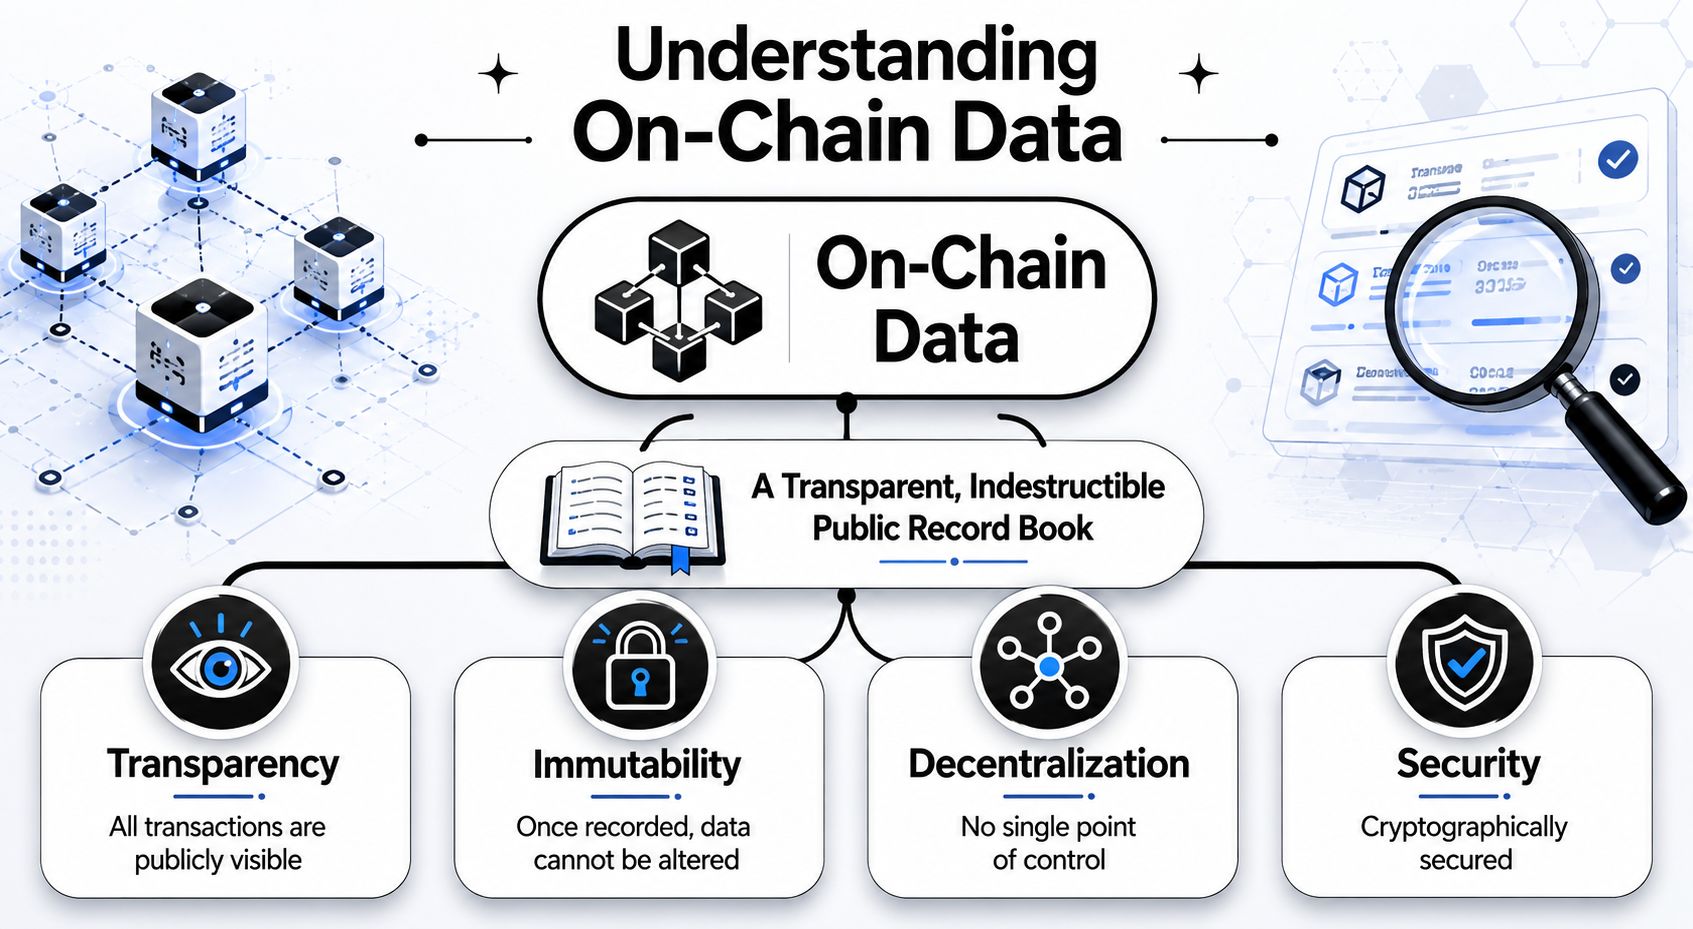
Think of a public blockchain as a record book sitting in the open. Anyone can inspect it. No single company controls it. Once a valid entry is written, changing it later is extremely difficult because the network relies on cryptographic hashing and distributed consensus to preserve ledger integrity, as Chainlink explains in its overview of on-chain data integrity.
That's the core of on-chain data. It's the transaction history, balances, contract interactions, and state changes recorded directly on a blockchain.
Public record versus private notes
A useful way to frame it is this:
On-chain data is the public registry. Deposits, withdrawals, swaps, borrows, repayments, wallet balances, and contract calls are visible on the ledger.
Off-chain data is everything reported around that activity. Team announcements, exchange data, screenshots, forum narratives, and internal spreadsheets.
Both matter. But they don't carry the same weight.
If a protocol says usage is rising, that's a claim. If more wallets are interacting with its contracts and stablecoins are flowing in from distinct participants, that's observable. Public blockchains made that kind of direct observation possible. Coinbase describes blockchains like Bitcoin and Ethereum as transparent ledgers where transactions are publicly accessible in real time, and notes that this approach traces back to Bitcoin's 2009 launch as the first widely adopted public ledger where activity could be measured from the network itself (Coinbase on what on-chain analysis is).
Why this matters for stablecoin decisions
For yield seekers, on-chain data answers questions that a glossy UI won't.
It shows actual usage
A stablecoin vault may advertise conservative risk. On-chain activity can reveal whether users are entering and staying, or whether deposits are rotating quickly in response to incentives.
It exposes dependencies
Some protocols look diversified until you inspect wallet concentration and realize a small set of addresses drives most of the capital or the borrowing demand.
It helps verify operational claims
If a market says liquidity is deep, you can inspect the contract interactions and fund movements supporting that claim.
Transparent doesn't mean simple. It means the raw evidence is available if you know what you're looking for.
What on-chain data does not do
It doesn't read intentions. It doesn't tell you why a whale deposited. It doesn't prove a protocol's governance is competent. It doesn't stop a bad strategy from looking busy.
That's why serious on-chain work is never just “look at the chart.” It's closer to reconciliation. You compare stated business logic with the ledger, then judge whether the behavior matches the story.
Decoding Key On-Chain Metrics for Yield
If you're allocating stablecoins, you don't need every metric under the sun. You need a short list that tells you whether usage is real, liquidity is usable, and the yield source has support beyond incentives.
Galaxy describes on-chain analysis as the study of native blockchain data such as transaction counts, wallet holdings, transfer volume, and active addresses. It notes that a sustained rise in daily active addresses alongside rising transfer volume can indicate expanding utility and genuine adoption (Galaxy on core on-chain metrics).
That idea matters more for yield than people realize. High returns can attract deposits quickly. Genuine utility is harder to fake for long.
The metrics worth tracking
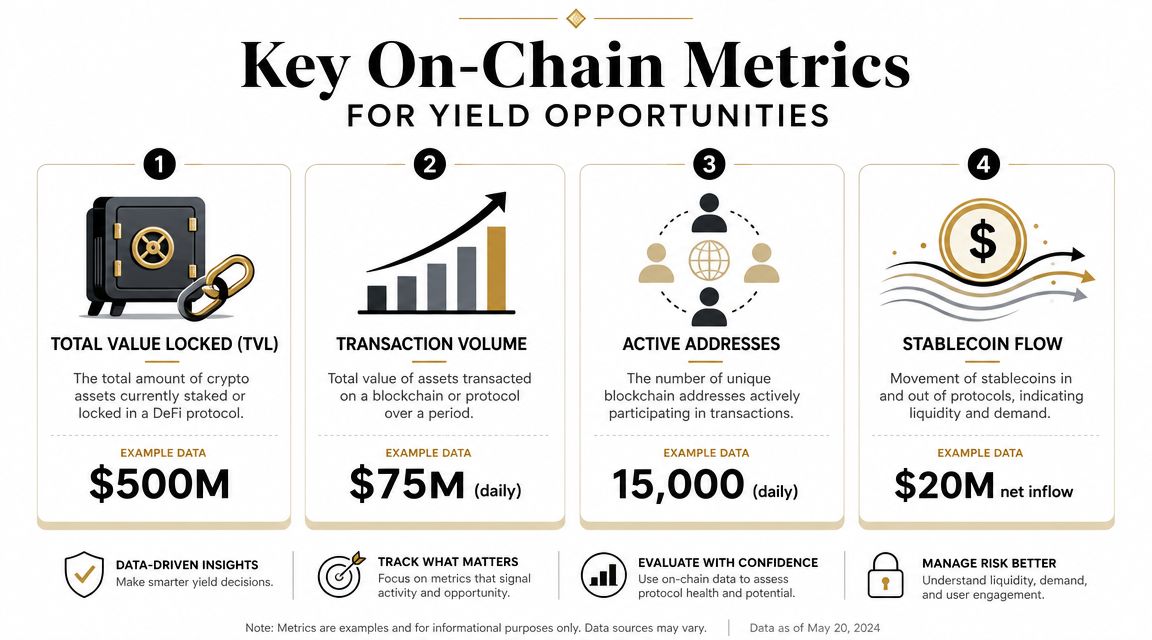
Total value locked
TVL tells you how much capital sits inside a protocol or strategy. It's useful, but only as a starting point.
A high TVL can mean trust, liquidity, and integration with the wider ecosystem. It can also mean one fund parked a large amount of capital there yesterday. TVL without user breadth is not strength. It's just size.
If you want a deeper framework for reading TVL behavior instead of treating it as a vanity metric, this breakdown on TVL tracking signals is worth a look.
Active addresses
This metric helps answer whether usage is distributed. More unique addresses interacting with a protocol over time usually suggests broader participation than one or two dominant actors.
For stablecoin yield, active addresses matter because they help separate product demand from balance-sheet theater. If TVL rises but address activity stays flat, a small set of wallets may be doing most of the work.
Transfer volume
Volume shows how much value moves through the protocol or related contracts. Rising transfer volume can support the idea that the protocol is serving a real function.
But volume by itself is dangerous. A protocol can generate lots of motion without generating healthy demand. The key is whether volume rises with user breadth and sensible contract usage.
Stablecoin flows
This is one of the most practical signals for yield allocation. Watch where stablecoins are coming from, where they go next, and whether inflows stay put or reverse quickly.
Net inflows can indicate rising demand for a strategy. Sharp inflows followed by fast exits often tell a different story. They may reflect mercenary capital chasing incentives rather than users committing to the venue.
A simple yield assessment table
Metric | What It Measures | What It Signals |
|---|---|---|
TVL | Capital currently deposited in the protocol | Scale, but not necessarily diversity or quality |
Active addresses | Distinct wallets interacting with contracts | Breadth of participation and possible adoption |
Transfer volume | Value moving through the system | Intensity of use, if paired with healthy user activity |
Stablecoin flow | Deposits and withdrawals of stable assets | Demand stability, liquidity pressure, and churn risk |
Contract interactions | How often users call key contracts | Whether the product is actually being used |
Liquidity depth | Available exit and trading capacity | How painful withdrawals or reallocations could become |
Transaction fees | Cost to use the chain or protocol | Whether the strategy remains practical after costs |
Reading combinations, not isolated numbers
Most investors improve fast. Stop asking whether one metric looks good. Start asking whether several metrics tell the same story.
Healthy pattern: TVL grows steadily, active addresses rise, transfer volume follows, and stablecoin inflows don't reverse immediately.
Questionable pattern: TVL jumps, active addresses barely move, volume spikes through a few contracts, then capital rotates out quickly.
Operational warning: Yield looks fine on paper, but fees, slippage, or shallow liquidity make exits expensive or slow.
A lot of traders already understand this logic from price-based tools. If you use volatility and trend filters in directional markets, the same discipline applies here. Resources on ATR and Bollinger Bands for crypto are useful because they train the same habit: don't trust a single signal when a fuller context is available.
For readers who prefer a quick visual primer before going deeper, this walkthrough is useful:
Reading the Signals From Data to Strategy
The hard part isn't finding on-chain data. The hard part is deciding what pattern deserves capital.
That matters even more now because on-chain visibility can be misleading. CrossRiver notes that transaction histories and TVL can be gamed, and that with stablecoin market cap exceeding $300 billion, users increasingly need signals that separate durable yield from noisy or manipulated yield (CrossRiver on transparent but not truthful data).

Scenario one with the wrong kind of growth
A protocol launches a stablecoin vault with a headline yield that quickly gets attention. TVL rises fast. Social chatter follows. A dashboard screenshot makes the market look alive.
Then you inspect the ledger more closely.
Contract interactions are concentrated. Stablecoins enter through a narrow set of wallets. Funds move between related contracts in repeating patterns. Address activity doesn't broaden much even as the headline numbers improve. That doesn't automatically prove fraud. But it does tell you the yield thesis is fragile. If a few actors are responsible for the appearance of growth, the strategy can unwind as quickly as it filled.
This is the type of setup where investors confuse visible activity with resilient activity.
The safest-looking chart in DeFi is often the one that hasn't been cross-checked against user breadth and exit conditions.
Scenario two with stronger footing
Now take a different protocol. TVL doesn't explode. It climbs in a more measured way. More wallets start using the relevant contracts. Stablecoin deposits are followed by ongoing borrowing, swapping, or collateral behavior that fits the protocol's business model. Liquidity around the strategy remains usable, and withdrawals don't trigger obvious stress.
That pattern is less exciting on day one. It's often better on month three.
For stablecoin yield, this second profile tends to matter more:
Participation expands instead of staying concentrated.
Capital stays productive instead of just passing through.
Behavior matches the mechanism the protocol claims to offer.
Liquidity looks practical for entry and exit.
A good analytics workflow helps tie those pieces together. If you're building a process around protocol monitoring, dashboard review, and wallet-level context, this guide to DeFi dashboard analytics is a useful companion.
Turning observations into decisions
In practice, I'd group protocols into three buckets.
Allocatable now: Multiple signals line up. Usage appears organic. Liquidity and exits look sensible.
Watchlist only: Some signs are constructive, but the picture is incomplete. Maybe TVL is rising without enough user breadth, or liquidity still looks thin.
Avoid for now: The protocol depends too heavily on incentives, concentrated wallets, or transaction patterns that don't map to genuine use.
That framework is simple on purpose. You don't need a PhD in data science to use on-chain analysis well. You need to stop treating every metric as a score and start treating them as evidence.
The Limits of On-Chain Analysis
On-chain data is powerful because the ledger itself is hard to tamper with. But that doesn't mean every conclusion drawn from it is sound.
That distinction matters. The record can be accurate while the interpretation is wrong.
Integrity is not the same as clarity
The blockchain will faithfully show you deposits, swaps, borrows, and repayments. It won't tell you whether those actions came from organic users, coordinated wallets, temporary incentives, or internal treasury operations.
That's why many bad allocations happen in full public view. The underlying data is real. The reading of it is sloppy.
Common mistakes include:
Overweighting short-term spikes: A sudden rise in deposits can look bullish when it's just incentive farming.
Ignoring concentration: Broad TVL can be healthy. TVL dominated by a few wallets is a different risk profile.
Confusing movement with demand: Circular flows can produce impressive volume while saying very little about durable usage.
Manipulation doesn't need fake data
The most common misunderstanding is that because the ledger is verifiable, the opportunity must be honest. That's not how this works.
A protocol or set of users can still create misleading impressions through behavior that is technically real but economically weak. Wash-like activity, sybil-style participation, and circular routing can all make a system look busier than it is.
One useful test: Ask whether the same activity would still happen if incentives were reduced. If the answer is probably not, don't treat the current numbers as stable.
A risk process should also account for what on-chain data can't capture cleanly. Governance quality, emergency response, smart contract design choices, and external dependencies often require judgment beyond the ledger.
For a practical framework on combining protocol behavior with position sizing and monitoring, this guide to on-chain risk management is worth keeping nearby.
What works better than prediction
The strongest use of on-chain analysis isn't crystal-ball forecasting. It's disciplined filtering.
Good operators look for consistency over time, confirmation across metrics, and behavior that matches the economic purpose of the protocol. They don't need certainty. They need enough evidence to avoid obvious traps and enough humility to size risk when the picture is mixed.
That's a much better use of on-chain data for stablecoins. You're not trying to win an argument about the market. You're trying to protect principal while collecting yield that has a credible reason to exist.
Automating On-Chain Insight with Yield Seeker
Individuals don't lose money in DeFi because the data was unavailable. They lose money because interpreting fragmented on-chain data every day is a job.
You need to watch flows, compare protocols, check whether contract activity still supports the yield, and decide when a change is signal versus noise. That's manageable for full-time operators. It's much harder for treasury managers, founders, or investors who just want stablecoins working productively without spending their week in dashboards.
What automation should actually do
A useful system shouldn't act like a magic box. It should do the repetitive parts of on-chain work reliably:
Monitor protocol behavior continuously
Track capital movement across strategies
Flag when usage patterns stop matching the yield story
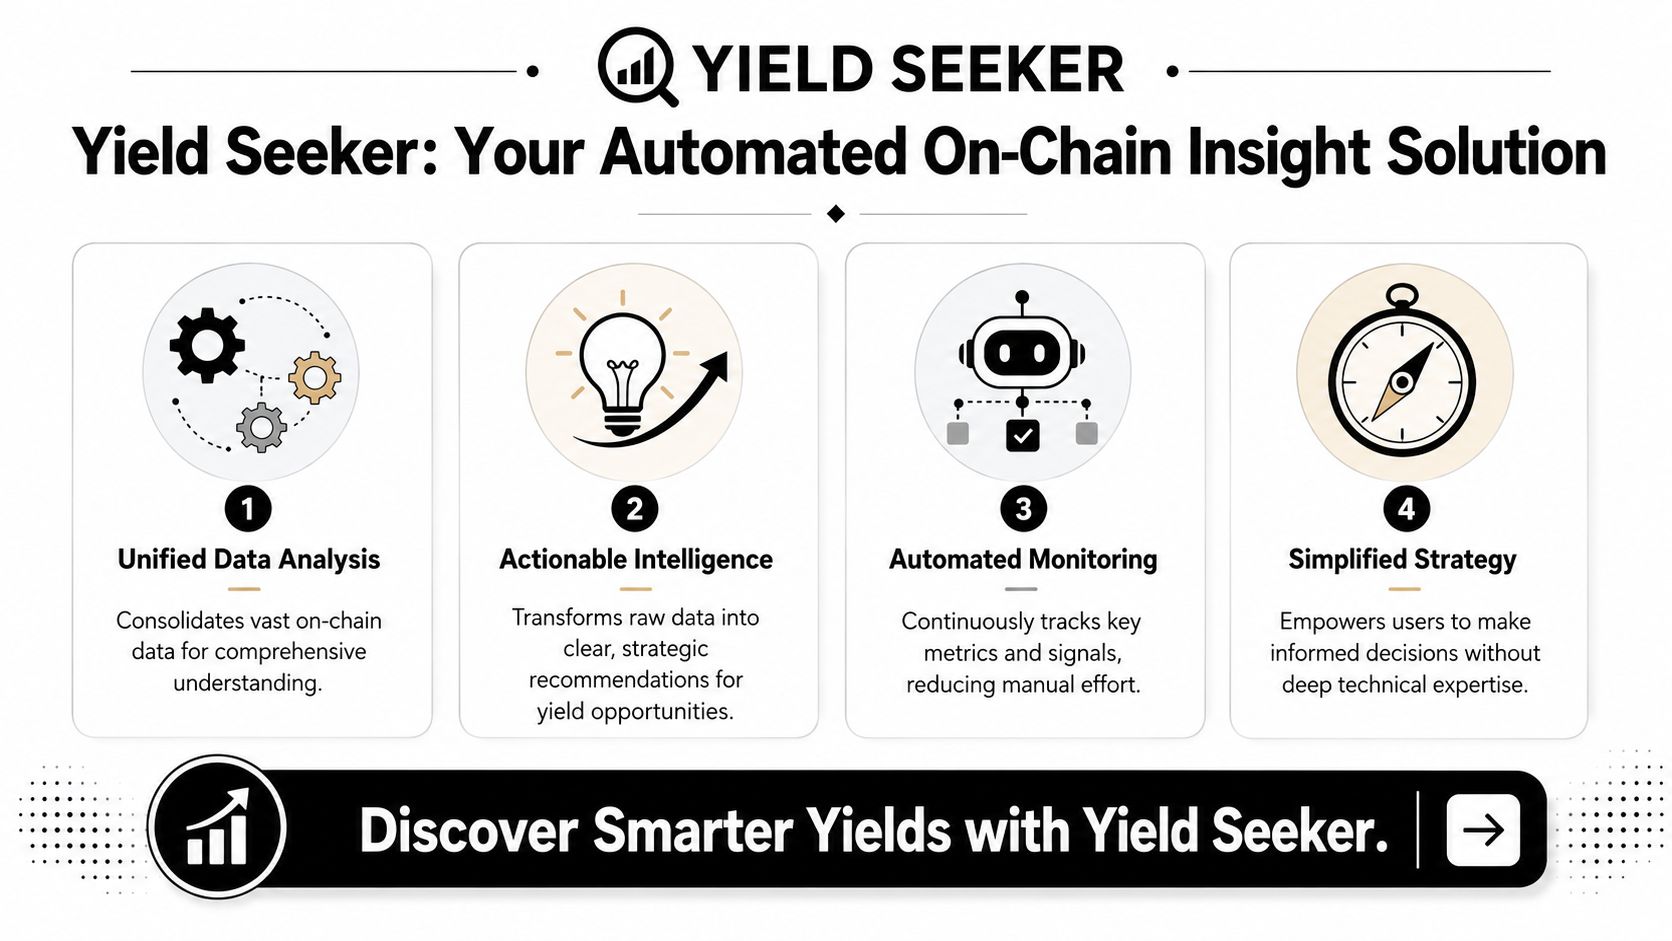
Reallocate based on risk-aware rules rather than impulse
That's the logic behind products built for automated stablecoin allocation. Yield Seeker is one example. It lets users deposit USDC on Base and use an AI agent to monitor and allocate across DeFi opportunities while keeping funds accessible and exposing the reasoning through a built-in interface and terminal.
Why this approach fits stablecoin users
Stablecoin yield is one of the clearest use cases for automation because the work is repetitive, cross-platform, and sensitive to changing conditions. You're not chasing meme coin momentum. You're trying to compound safely while avoiding strategies that only look healthy from a distance.
That means good automation needs to be opinionated about risk, not just fast at reallocating. It should prefer interpretable signals over dashboard cosmetics.
A parallel from trade journaling helps here. Tools that organize execution and review are valuable because they reduce decision fatigue and force consistency. That's one reason products like TradeTally features resonate with active traders. They turn scattered activity into something reviewable. On-chain yield tools should aim for the same outcome: clear monitoring, visible reasoning, and less guesswork.
What not to outsource blindly
Automation helps most when the user still understands the principles.
You don't need to inspect every transaction manually, but you should still know the difference between healthy inflows and hot-money churn. You should know why concentration risk matters. You should know that rising TVL means less than many people think if the supporting behavior is weak.
That's the right relationship with an on-chain yield tool. Let the system handle the constant monitoring. Keep enough understanding to judge whether its behavior fits your own risk tolerance.
For stablecoin holders, that's the practical endgame. Use on-chain data as a decision layer, not as entertainment. Let software do the repetitive watching. Keep human judgment focused on risk, capital goals, and whether the yield source still makes economic sense.
If you want a hands-off way to put those principles into practice, Yield Seeker lets you deposit USDC and use an AI agent to monitor on-chain opportunities, assess risk, and allocate capital across DeFi without manually juggling protocols and dashboards.